You are not logged in.
- Topics: Active | Unanswered
Pages: 1
#1 2021-04-13 15:24:26
- IF_Eduardo
- Administrator
- Registered: 2016-11-01
- Website
Charts in ReportServer
Hi,
as we have received many questions on charting capabilities in ReportServer, pls. note the following:
you can create graphical reports such as bar, pie charts in both pivot reports and mondrian reports. These are highly dynamic reports.
BIRT, Jasper, Excel and Crystal Reports also support charts.
You can see examples of a Saiku / BIRT / Jasper Reports in the online demo: https://reportserver.net/de/demo/
user: demoadmin
password: demoadmin
Saiku and Pivot reports are highly dynamic reports. With just a click, you can create different types of charts for the same report. As an example, check the following representations of the same report:


Pivot Report charts are analogous.
Here you can see two examples of a bar chart in a BIRT report: http://demo.raas.datenwerke.net/?locale … 5846801178 and http://demo.raas.datenwerke.net/?locale … f0b2c46f52


Here an example of a pie chart in a Jasper report: http://demo.raas.datenwerke.net/?locale … 38a7bc539f
You can create even maps/ almost type of chart report with script reports:
http://demo.raas.datenwerke.net/?locale … acb14f243a

Script reports also allow you to create charts easily. These are highly customizable, as you control the charting libraries directly.
We added a Highchart example (Script report) here:
https://github.com/infofabrik/reportser … ighcharts/
You can find the chart here:
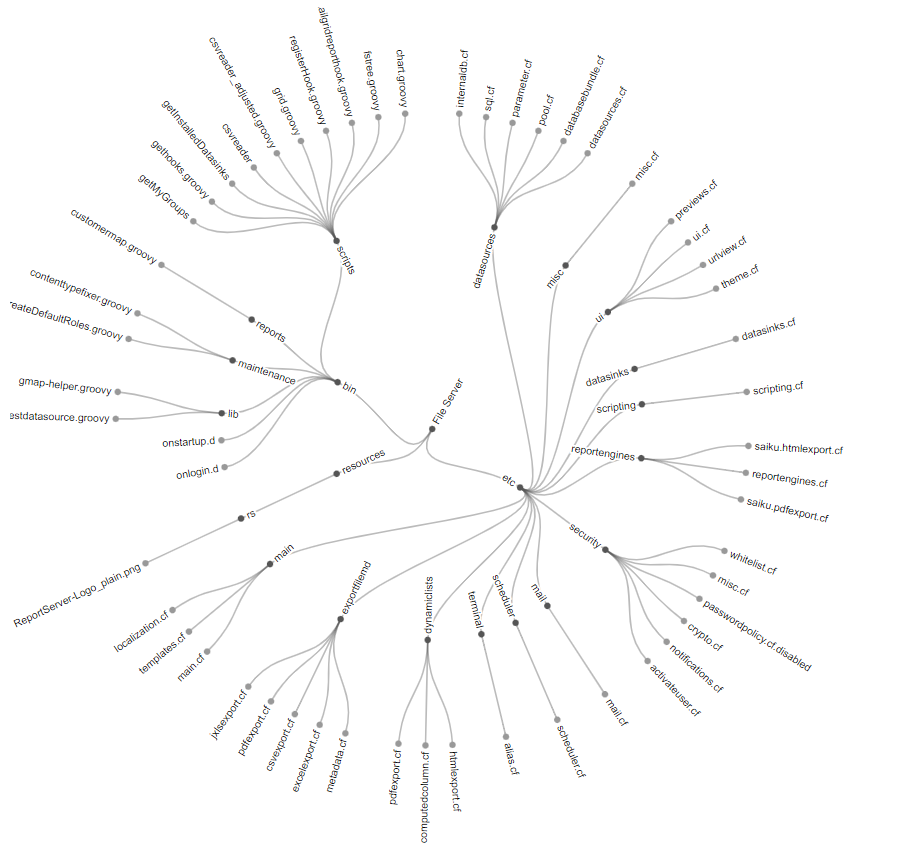
We added a D3 example (Script report) here:
https://github.com/infofabrik/reportser … adialtree/
You can find the chart here:
You can also render DOT graphs to SVG and display them in your browser as shown in the following example:
https://github.com/infofabrik/reportser … riptreport
You can find the result here:
Further, you can also use JXLS Templates to create Excel charts (JXLS Reports or JXLS Template for dynamic list). An example can be found here: https://github.com/infofabrik/reportser … xlsreports (chart.xlsx and chart_result.xlsx). Thanks @Johann for this example: 
More information on:
Jasper: https://reportserver.net/en/guides/admi … erReports/
BIRT: https://reportserver.net/en/guides/admi … ipse-Birt/
Pivot: https://reportserver.net/en/guides/user … amic-List/
Saiku / Mondrian: https://reportserver.net/en/guides/admi … n-Reports/
Script: https://reportserver.net/en/guides/scri … Reporting/
Excel: https://reportserver.net/en/guides/admi … S-Reports/
Your ReportServer Team
Offline
#2 2022-06-09 07:10:26
- Johann
- Member
- Registered: 2022-05-30
Re: Charts in ReportServer
Further, you can also use JXLS Templates to create Excel charts (JXLS Reports or JXLS Template for dynamic list).
May I clarify how exactly can this be done and if there is any documentation we can refer to for instructions and/or examples? I've looked at https://reportserver.net/en/guides/admi … S-Reports/ but cannot seem to find a section on charts. Any advise would be appreciated, thank you!
Offline
#3 2022-06-09 08:39:16
- IF_Eduardo
- Administrator
- Registered: 2016-11-01
- Website
Re: Charts in ReportServer
Hi Johann,
this should work in an analogous way as standard excel charting. Pls check the excel documentation on this and also the jxls documentation: http://jxls.sourceforge.net/
you are of course welcome to contribute with an example in the github if this works for you.
Regards,
Eduardo
Offline
#4 2022-06-09 10:13:05
- Johann
- Member
- Registered: 2022-05-30
Re: Charts in ReportServer
Hi Eduardo,
Right, thank you! If I would like to contribute with an example, do I make a pull request on the Github repo (https://github.com/infofabrik/reportserver)? Sorry I am not too familiar with contributing procedures.
Offline
#5 2022-06-09 10:22:42
- IF_Eduardo
- Administrator
- Registered: 2016-11-01
- Website
Re: Charts in ReportServer
Hi Johann,
yes, you can create a pull request. For examples, you can use this repo: https://github.com/infofabrik/reportserver-samples
Regards,
Eduardo
Offline
#6 2022-06-09 10:31:28
- Johann
- Member
- Registered: 2022-05-30
Re: Charts in ReportServer
Got it, thank you Eduardo!
Offline
#7 2022-06-14 09:44:41
- IF_Eduardo
- Administrator
- Registered: 2016-11-01
- Website
Re: Charts in ReportServer
Hi Johann,
many thanks for your contribution. I merged your pull request, made minor modifications (version number, instructions, last-tested version) and pushed the example into the jxls-examples repository: https://github.com/infofabrik/reportser … xlsreports (chart.xlsx and chart_result.xslx). I also created this ticket for next reportserver release:
RS-5902: Add JXLS charting example
for letting the users know about the new charting example.
Again, thanks for creating this example and the pull request.
Regards,
Eduardo
Offline
#8 2022-06-16 02:38:07
- Johann
- Member
- Registered: 2022-05-30
Re: Charts in ReportServer
Hi Eduardo,
Thank you for merging my pull request! It is my pleasure to contribute, and I hope it will help others who are working with JXLS charts too.
Just curious, where can the ticket be viewed?
Regards,
Johann
Offline
#9 2022-06-17 07:51:29
- IF_Eduardo
- Administrator
- Registered: 2016-11-01
- Website
Re: Charts in ReportServer
Hi Johan,
the implemented / fixed tickets can be seen in the release notes of the versions.
The open tickets are not publicly available, they are located in our internal ticketing system.
Regards,
Eduardo
Offline
#10 2022-06-17 10:15:56
- Johann
- Member
- Registered: 2022-05-30
Re: Charts in ReportServer
Hi Eduardo,
I see, thank you for clarifying!
Regards,
Johann
Offline
#11 2022-08-01 08:40:19
- IF_Eduardo
- Administrator
- Registered: 2016-11-01
- Website
Re: Charts in ReportServer
Hi,
note that we added a D3 example chart to the list above.
Regards,
Eduardo
Offline
#12 2023-05-22 15:19:55
- IF_Eduardo
- Administrator
- Registered: 2016-11-01
- Website
Re: Charts in ReportServer
Hi,
note that we added a DOT graph (SVG) example to the list above.
Regards,
Eduardo
Offline
Pages: 1